Debugging slow Jest tests
(pssst: nothing in this article will make your tests faster than just migrating to vitest)
I'm a big fan of writing unit and integration level tests instead end-to-end tests as much as possible, as it typically means test assertions are made lightweight environments, without need for running the app in a browser.
Recently however as my team has focussed more on writing smaller, incremental tests, we've started to see a problem with Jest. Most notably, our tests are fast, but the suites they run in overall are very very slow:

Here, our suite SiteHrefSeo.test.tsx comprises of two tests, taking a total of 42ms to run - but the suite takes nearly 8 seconds!
In building anything beyond a hobby project, this sort of time delta adds up dramatically (tests for this particular blog take 0ms). Our continuous integration was continuous in the absolute sense, much to the fustration of engineers and the comapny's finance team alike.
Initially looking at some problematic suites, the slowest ones seemed to be those that rely heavily on MSW, and generally a lot of async behaviour (spoiler - it's not this!). Either way it had progressively got worse in previous couple of months. My initial thoughts:
- Can we run tests across multiple containers
- Does more compute help?
- Is coverage reporting slow?
- Can we simplify MSW setup in
jest.setup.ts? - Can we simplify jest setup in general?
- Is jest just too slow?
Parallelising tests on circle
CircleCI has a tutorial on splitting multiple test suites across different nodes. I breifly looked into this, but quickly discarded the approach.
Fundamentally, the actual slowness was not solvable by parallelisation. It's not a case that the overall run of all project tests is too slow, but that individual suites were too slow. Had it been the overall test run, theoretically I could have sped things up by a factor of n by running across n containers. But as the issue was suite-level slowness, a slow suite was still going to timeout and fail even if I gave it a node all by itself.
Increasing compute
Looking at the workflow's resources, the job was not really limited by compute/memory:
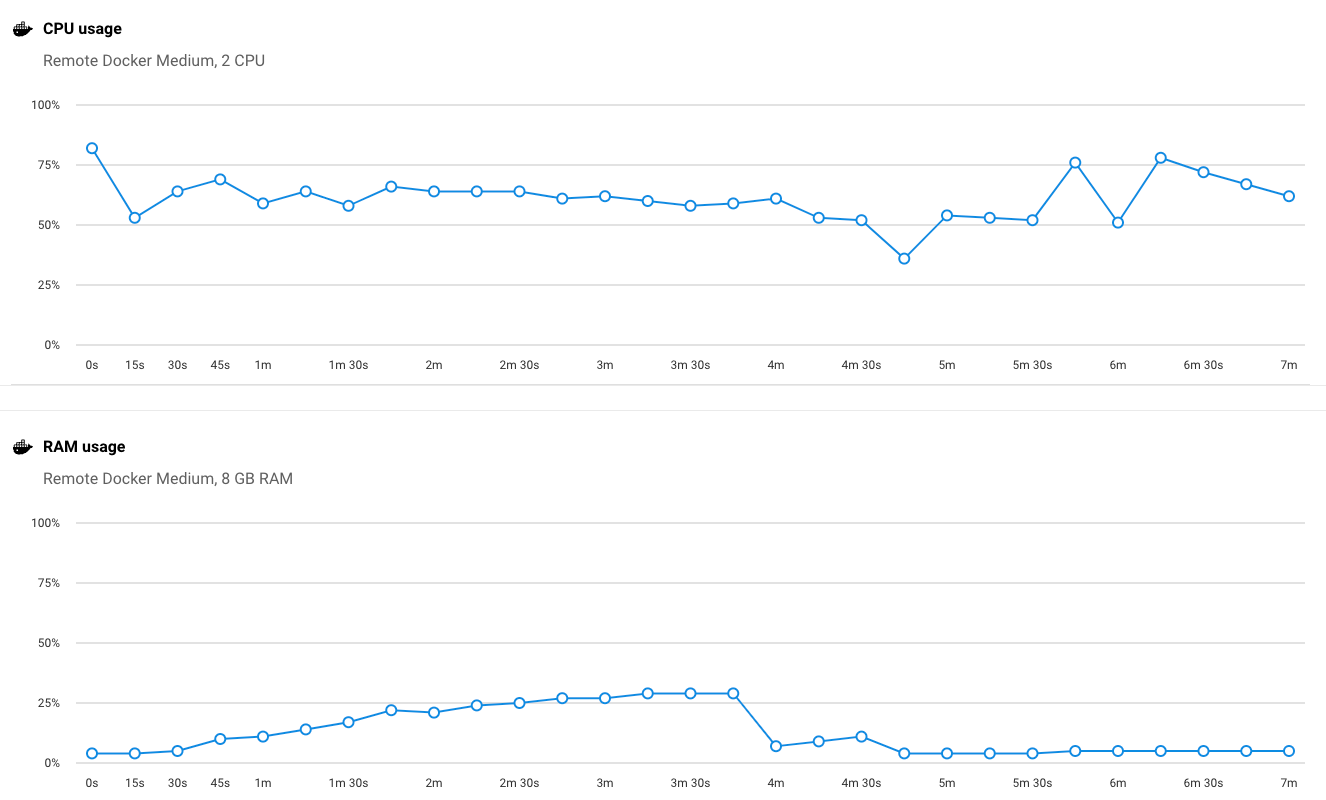
On occasional runs I'd see spikes to 100% CPU, but nothing consistent. Bumping the resource class up to a medium+ knocked about 30 seconds off the overall run, but couldn't be justified by a 50% increase in credit usage.
Coverage reports
Skipping test coverage reporting didn't speed up tests at all, which is fine in a way as the report is a non-negotiable imo, especially if we want to integrate with sonarqube later on.
Simplifying MSW setup
This was my main suspect. I had joked with a colleague that it wouldn't have been a complete surprise to me if I reached the end of the investinagtion and concluded 'tests that do lots of asynchronous work are just slow'. However, we were seeing slowness in lots of 'dumb' component suites, which didn't seem rational. By dumb I mean synchronous tests, that render a component with varying props, and make a few assertions. Could setting up more than was needed in the test environment be what was slowing 'dumb' tests down?
We currently set up MSW with every handler active in jest.setup.ts, and I figured there could be performance gains to be had in the slow tests where these weren't needed. What I mean by this is we effectively have a setupServer(...handlers) call followed by a server.listen() call in jest.setup.ts, meaning that MSW has every possible request handler registered, when many tests wouldn't be doing anything asynchronous.
To test this I wanted to profile a suite with a single empty test, with different levels of MSW setup:
- with no handlers registered
- with all handlers registered in
setupServerin abeforeEachinjest.setup.ts - with handlers registered using
server.usein andbeforeEachin the test suite's outermostdescribeblock
describe('Expect profiling', () => {
    it('will help me fine the issue', () => {});
})
To do this I used Node's profiler, following Jest's docs on the subject.
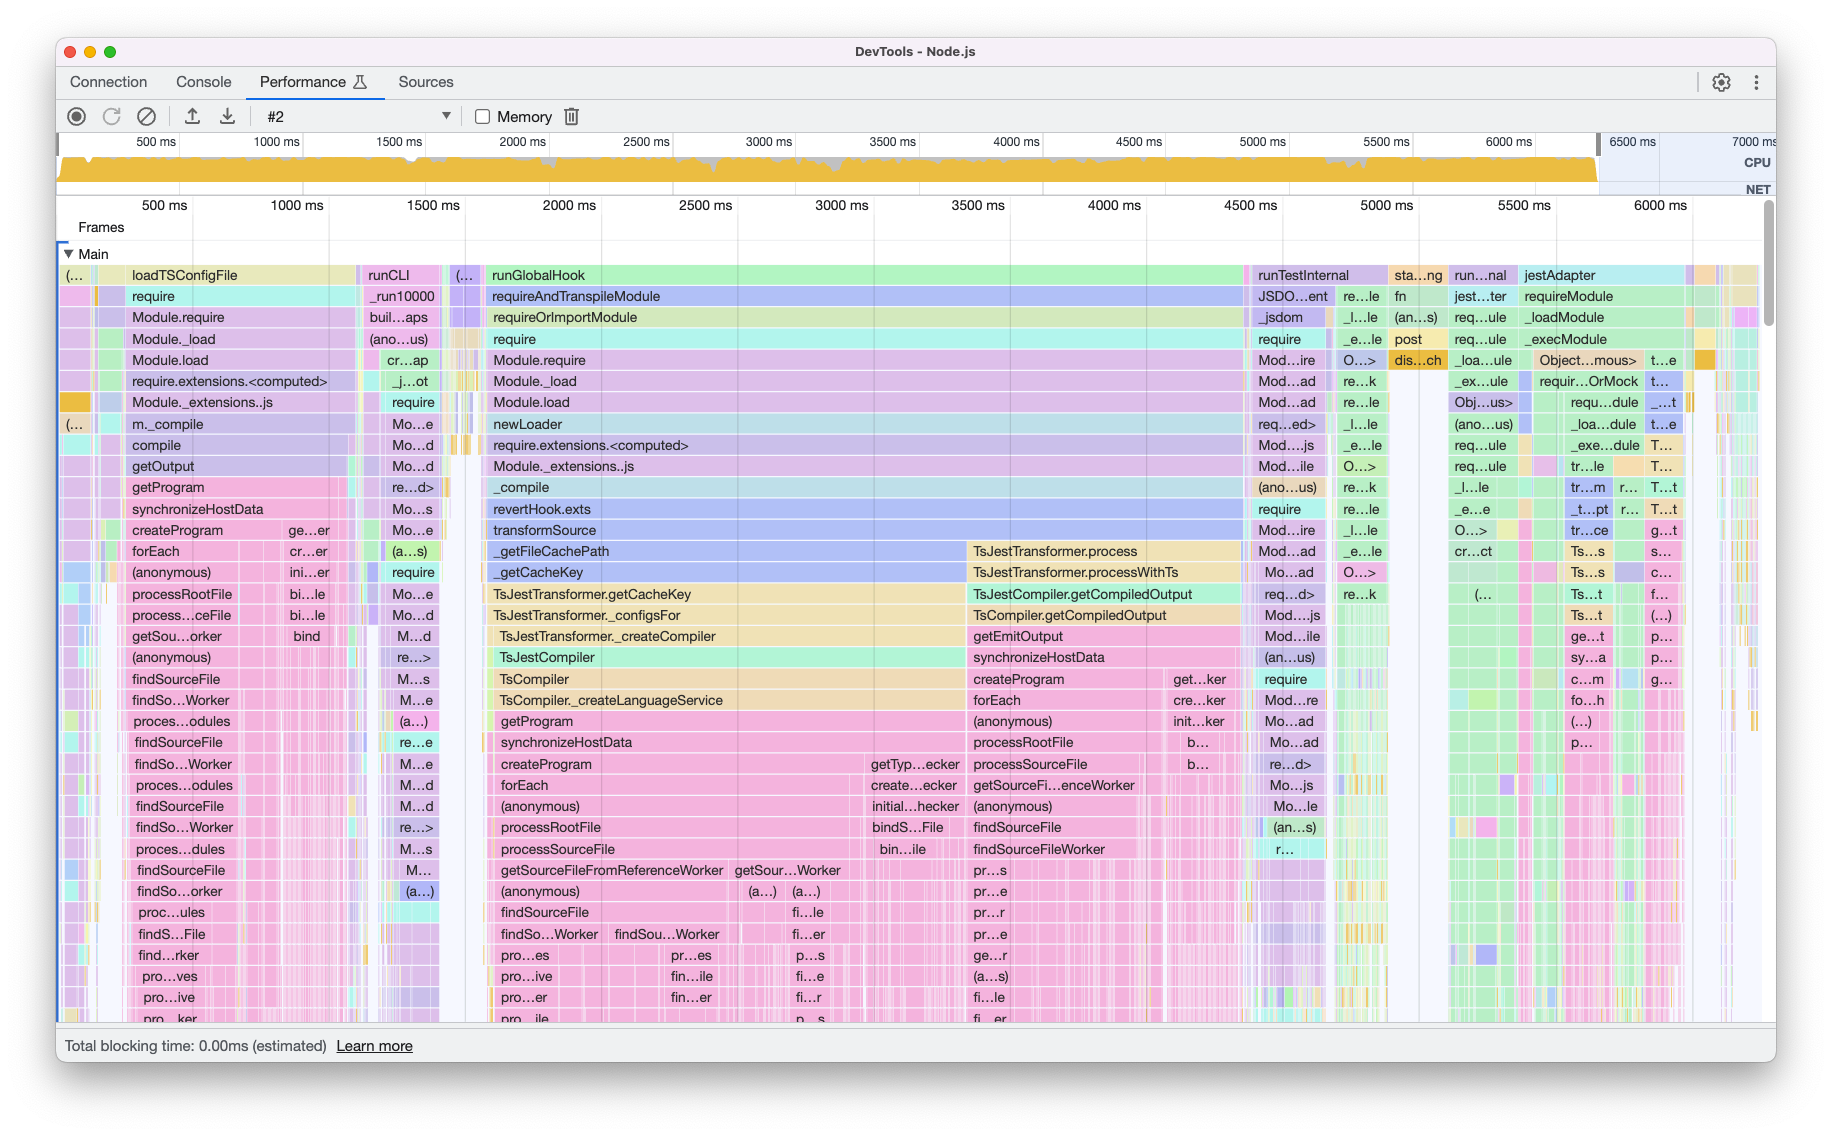
Here's a couple of performance reports. First, without any handlers registered:
And with any number of handlers registered:
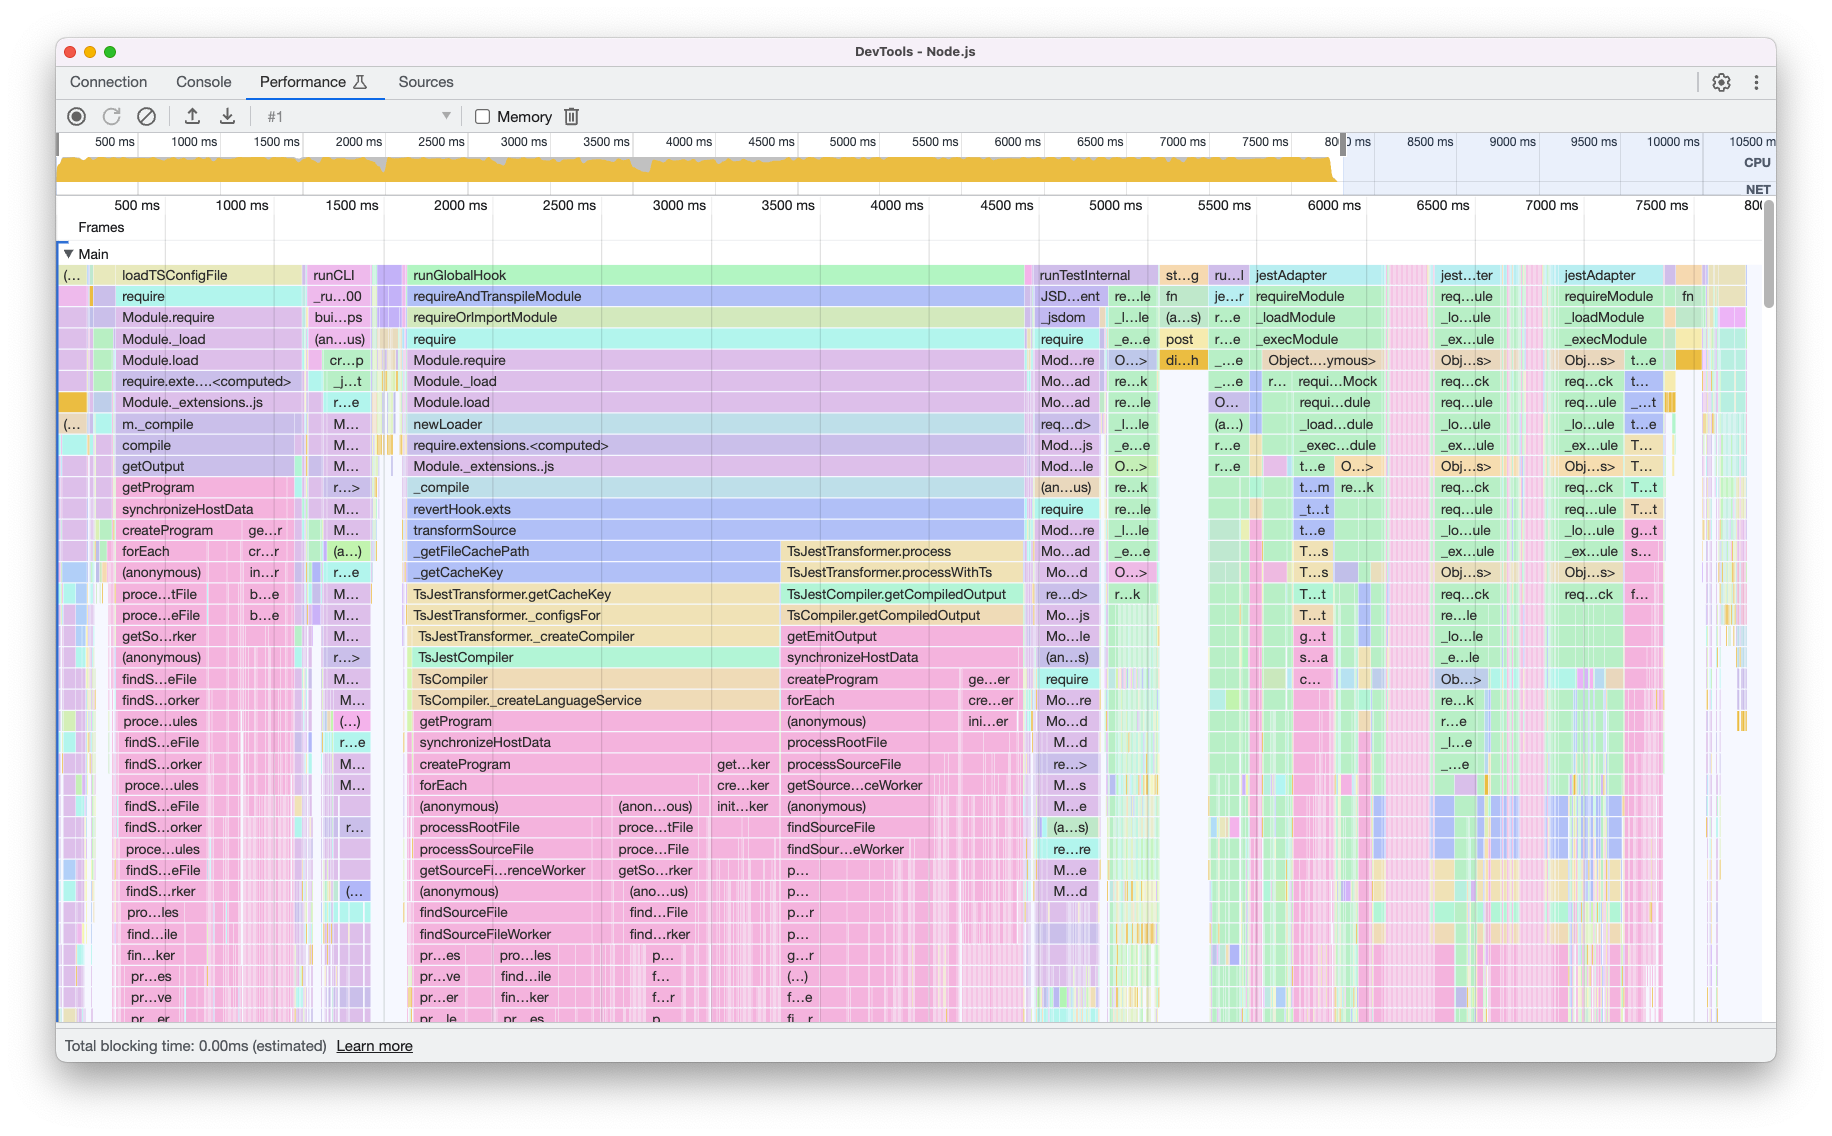
The first thing I noticed was that loading in tsconfig takes about a second, followed by a relatively large runGlobalHook call, which takes 2.5-3 seconds.
I initially assumed this was not an issue, and this was jest setup for all tests/suites. Wrong!
I also noticed 2/3 jestAdapter calls, which (I think) is Jeset running things like beforeEach, beforeAll, afterEach, afterAll, and resolving imports.
- With handlers registered in
jest.setup.js, the initialjestAdaptertakes around 700ms, and the second takes 200ms. - With handlers registered in the test suite, the initial
jestAdaptertakes around 600ms, and the second takes 300ms. - With no handlers registered, there's just one
jestAdaptercall, which knocks off ~1 second.
So it looked like as long as there were request handlers registered, moving where they were registered wouldn't have a meaningful impact - only removing them. The subtasks of the jestAdapter calls are largely requireModule calls, as Jest seems to do a depth-first search for imports to resolve. Including handlers increases this. So we could benefit from the per-test suite registration approach in test suites that don't rely on MSW, but would not likely see an improvement in tests that do need MSW (which are our slowest tests).
In future, if we add significantly more handlers, we could see tests slow down. By moving handler registration into only the tests that need them, we could reduce the runtime of suites with no async behaviour. However...
Simplifying Jest setup
Have you noticed what it is yet?
- I've mentioned a few times we have a
jest.setup.ts, not ajest.setup.js - Loading in
tsconfig.jsoninto the test takes about a second - Jest seems to do a depth-first search for imports to resolve
Here's a trimmed down version of our jest.config.ts:
import { pathsToModuleNameMapper } from 'ts-jest';

// use the main tsconfig compiler options to get path config for imports
import { compilerOptions } from './tsconfig.json';

module.exports = {
    preset: 'ts-jest/presets/default-esm',
    extensionsToTreatAsEsm: ['.ts'],
    testEnvironment: 'jest-environment-jsdom',
    globalSetup: './jest.env.ts',
    setupFilesAfterEnv: ['./jest.setup.ts'],
    transform: {
        '^.+\\.(js|jsx|ts|tsx)$': [
            'ts-jest',
            { presets: [['@babel/preset-env', { targets: { node: 'current' } }], '@babel/preset-typescript'] },
        ],
    },
    globals: {
        NODE_ENV: 'test',
        window: {},
        'ts-jest': {
            tsconfig: 'tsconfig.test.json',
        },
    },
    moduleFileExtensions: ['js', 'jsx', 'ts', 'tsx'],
    moduleDirectories: ['node_modules', 'src', '<rootDir>/'],
    modulePaths: [compilerOptions.baseUrl],
    moduleNameMapper: {
        ...pathsToModuleNameMapper(compilerOptions.paths),
        '\\.(jpg|jpeg|png|gif|eot|otf|webp|svg|ttf|woff|woff2|mp4|webm|wav|mp3|m4a|aac|oga)$':
            '<rootDir>/__mocks__/fileMock.js',
    },
    ...
};
Perhaps you have. I was kicking myself when I found it.
So my attention turned to our Jest setup. Surely we were doing something wrong here?
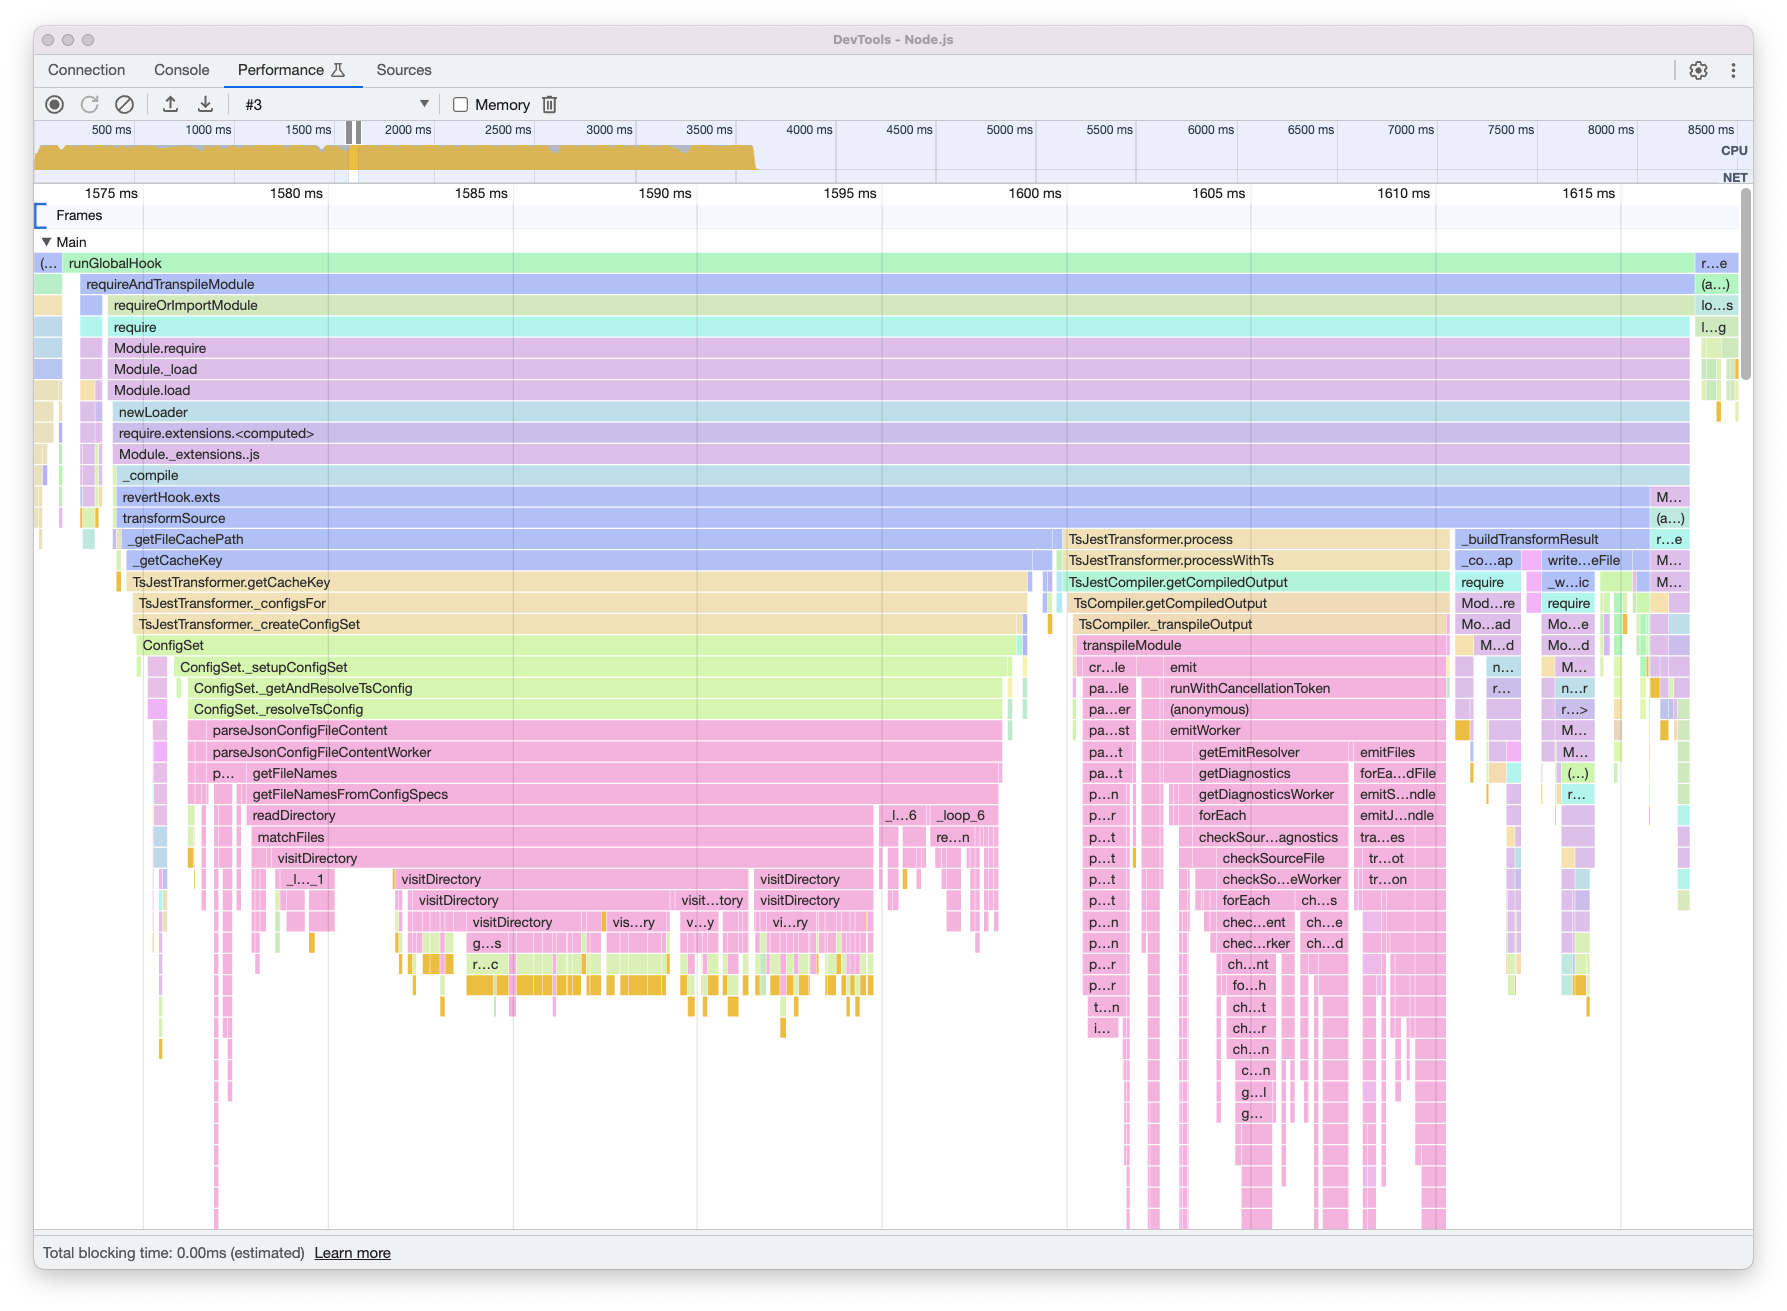
To try and reduce the time taken for the runGlobalHook call, I removed our globalSetup config, so now we only had a setupFilesAfterEnv option. But the runGlobalHook call was still present in the resulting profile!.
Looking into the profile deeper, I found that there were fairly slow steps within it still due to ts-jest, the transformer which turns our source ts/tsx files into js for Jest to run. There was one particular TsJestCompiler call which creates the TypeScript language service, to then type check the code as it transforms - taking a whopping 1.7secs!
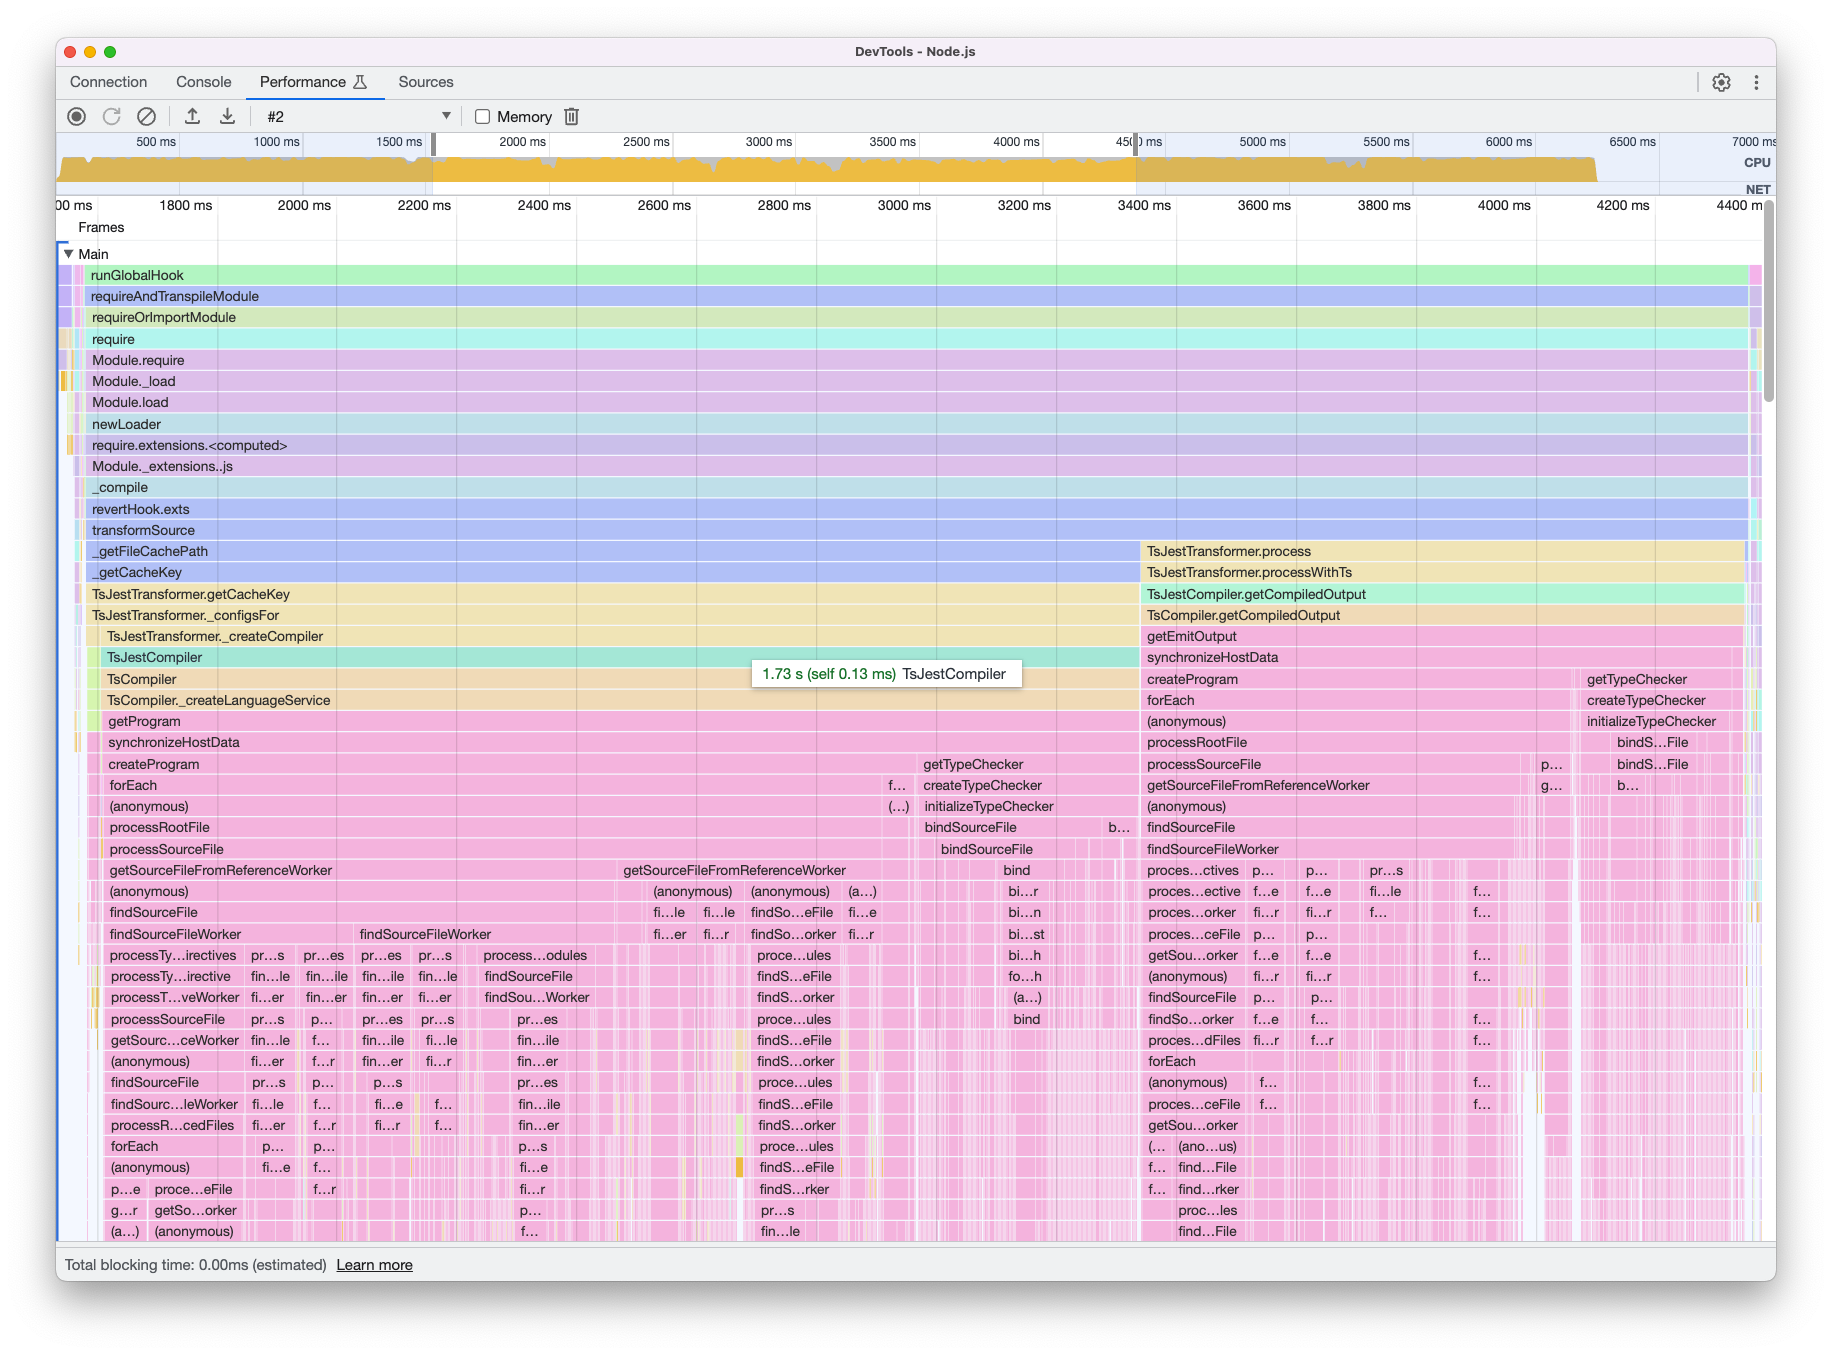
I updated our ts-jest config to skip the type check by adding isolatedModules: true to our ts-jest config. This reduced test times significantly - the expensive TsJestCompiler step is completely gone, and the entire globalSetup call has reduced to around 50ms.
In doing this, I also read in Jest docs:
globalSetup: This option allows the use of a custom global setup module setupFilesAfterEnv: A list of paths to modules that run some code to configure or set up the testing framework before each test file in the suite is executed
TIL that setupFilesAfterEnv runs before every suite. Consequently, the slow TS compile step would have been duplicated across all our suites.
With the type check removed, our CI times reduced by about 65%.
But what about type safety!!!!!
A valid point. Ultimately, Jest - or any part of the unit/integration test lifecycle - is not the place for a type check.
Instead, we now run a simple tsc --noEmit in CI prior to running tests. It takes 7 seconds for the entire codebase, and as a happy accident it's easier to hack together a test locally with some partial data without ts-jest throwing it's toys out the pram when you run.